TWO WEEKS INTENSIVE TRAINING ON FOREX TRADING
TWO WEEKS INTENSIVE TRAINING ON FOREX TRADING
Come and learn how you will become a certified and profitable forex trader and create a sustainable and passive income for yourself by leveraging on our automated forex trading system.
Swissfx Academy In Partnership With SkillBoostAfrica Limited
With its low entry barriers, high liquidity, and the availability of leverage, Forex trading allows individuals to diversify their investment portfolios and capitalize on global economic trends.

Our Instructors are among the best Trainers and Consultants in Nigeria.
This program is designed to hold you by the hand and show you all the tools, trick and techniques practically. You will learn all these by DEMONSTRATION. No theory.
This comprehensive tutorial is designed to provide you with a valuable resource, similar to forex trading for beginners Whether you're new to the forex market or looking to enhance your knowledge, this training will guide you through the fundamentals, strategies, and essential concepts to help you embark on your forex trading journey with confidence. Get ready to dive into the fascinating realm of currency trading and unlock the potential for financial success.
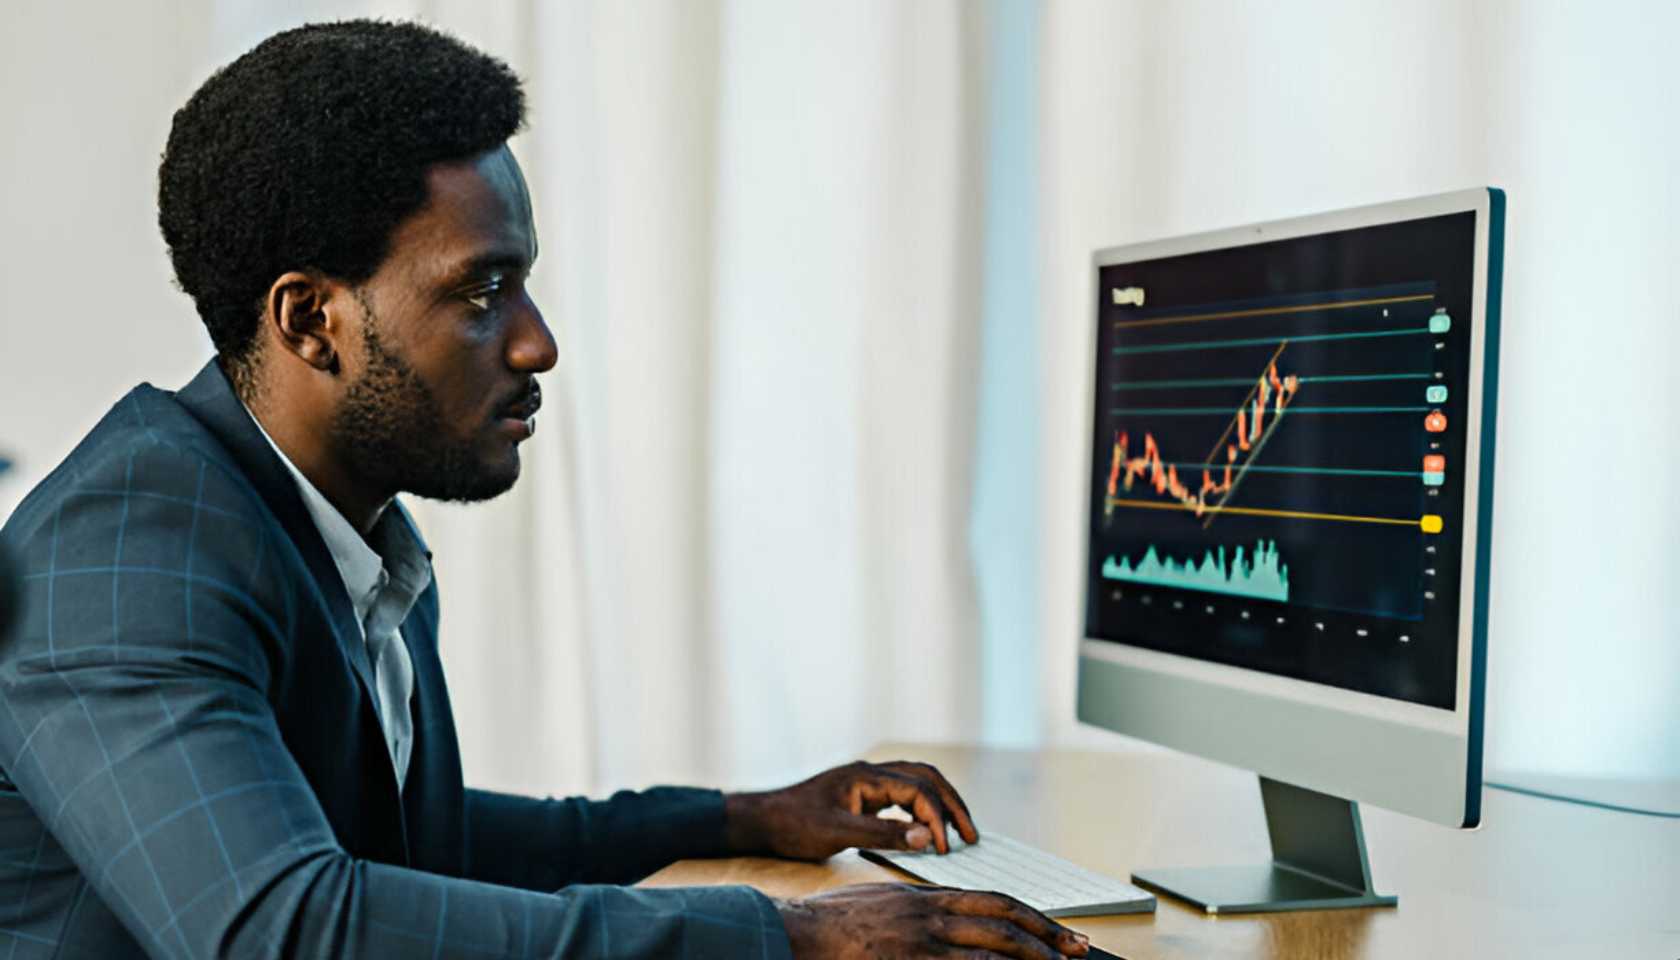
We put you through what is involved with automated systems to trade both if you so desire. While a fundamental analysis typically focuses on long-term returns, a technical analysis focuses on optimising a short-term trade
Demand for the asset improves as prices decline, which forms the apparent support line. On the flip side, resistance levels, or zones, can also arise due to overwhelming selling interest as a pushback to increasing prices.
Support zones are regions where a downtrend is anticipated to be at a standstill due to heightened demand.
Once a support or resistance level has been identified, it can serve as a potential entry or exit point. However, as the price action reaches a point of support or resistance, it will likely do one of two things:
1. bounce back away from the support or resistance level, or,
2. break through the price level and continue in its direction — until the price action meets its next hurdle in the form of another support or resistance level.
We also have customized indicators that will aid you if you wish to have it on your chart without drawing the zones.
There are different patterns as we shall show you in real live trading environment. Learn how to read a candlestick chart and spot candlestick patterns that aid in analyzing price direction, previous price movements, and trader sentiments.
The Supply and Demand is a new technique that we will start to forward test. This technique is based off of Supply and Demand zone trading, and is our basic interpretation of some of the lessons given by Micah the Fxanalyst since 2005.
Relax and learn multifarious strategies that will make you a consistent and profitable trader.
Multiple time-frame analysis involves monitoring the same currency pair across different frequencies or time compressions. While there is no real limit as to how many frequencies can be monitored or which specific ones to choose, there are general guidelines that most practitioners tend to follow.
This approach has been tested and proven using our insight on the market.
Though, some traders trade plain chart which we can also expose you to , we help you identify how you can use MAs while trading that can help identify trends and it become significant in building reliable trading strategies. If price action is above a moving average it can be indicative of long positions, while if the price action is below the moving average, it can be an indication that short positions ought to be taken.
You are covered too with our concept of this method.
We specialize in the use of sophisticated auto-trading strategy that is second to none. Though, our trading experience in foreign exchange started since 2005, we have been able to integrate a good EA that is sustainable. Algorithmic trading (also called automated trading, black-box trading, or algo-trading) uses a computer program that follows a defined set of instructions (an algorithm) to place a trade. The trade, in theory, can generate profits at a speed and frequency that is impossible for a human trader.
Hence, You can count on our top-notch trading results that are second to none as we are putting smiles and happiness in homes locally and internationally using our automated trading strategy.
Early Bird*: Pay N50,000 Instead of N100,000
Day: Tuesday, Thursday & Saturday
Time: 11 AM - 2 PM
Duration: 2 Weeks
Start Date: 9th July 2024
Day: Monday, Wednesday & Friday
Time: 2PM - 5PM
Duration: 2 Weeks
Start Date: 29th April 2024
Day: Monday, Wednesday & Friday
Time: 3PM-6PM
Duration: 2 Weeks
Start Date: 8th July 2024
Testimonials
99% of our previous students rated us 5 stars.
Don’t take our word, just read what some of them have to say.
Forex Trading simply means the exchange of our currency to another, for example using naira to exchange and buy dollar, Forex Trading is the one of the largest financial market in the world with about $6.6 Trillion Dollars traded everyday, Forex Trading has the highests potential to create wealth in people’s live than any other business
Forex trading is done through a network of banks, brokers, and other financial institutions. When you place an order to buy or sell a currency, it is routed through this network to find a counterparty who is willing to trade with you.
The price of a currency is determined by supply and demand. If more people want to buy a currency than sell it, the price will go up. If more people want to sell a currency than buy it, the price will go down.
If you want to start forex trading, you will need to open a trading account with a forex broker. There are many different brokers to choose from, so it is important to compare them before you make a decision. Once you have opened a trading account, you will need to deposit some money. The amount of money you need to deposit will vary depending on the broker you choose. Once you have deposited money into your account, you can start trading. You can trade currencies using a variety of different tools and strategies.
If you desire financial freedom and breakthrough this year 2024 and beyond, then swissfx is the answer, our consistent trading results spanning across months and years speaks volume for us, there is total transparency in oour system which you can come and see for yourself in our office. We show you the live trading performance of our robot on real live forex accounts.
Our Automated trading robot makes between 40 – 50%, infact we have so many of our clients that have made up to 100% of their capital in a month and they have withdrawn their capital and now trading with their profit just in one month.
With a minimum of $100 (around N150,ooo), you will be connected to our trading robot and you will start making profit everyday.
Unlike similar firms that existed in the pasr, we are uniqque in the sense that you are not giving your money to us to trade for you, you deposit your money directly to your forex brokers account by ourself and yoou know that forex brokers are lioke banks, they have office in Nigeria, they are registered, licensed and regulated just like banks so your money is 100% secured, safe and under your control and you can choose to withdraw it anytime you like without any restriction. We don’t have access to your funds, we only guide on howw you can register, verify and fund your account with the forex broker, thereafter we will connect and link your account to our forex trading robot and it will start trading for you and you will start making money immediately.
Don’t just work for money but let your money work for you. Its not the harder you work that makes you wealthy but the harder your money work. Take control of your finances and let the cash flow rolling like never before.
© 2024 SkillBoost Limited
After payment, send a WhatsApp message to 07030163486
After payment, send a WhatsApp message to 08028973599
After payment, Send Your Receipt The WhatsApp Number 08028973599